
A KPI, or Key Performance Indicator, is a single, quantifiable measure of business performance in a given category. From common financial metrics like a company's net profits to more specific HR KPIs like absenteeism rates, you can track just about anything that might contribute to an organization's overall success. The resulting data, when analyzed properly, can be used to set more realistic goals, forecast future performance, and improve strategies and business practices.
As HR professionals and people leaders, we often find ourselves needing to be in two places at once – the present and the future. The right KPIs can simplify this particular task, helping us to anticipate turnover and attrition, improve efficiency, build better budgets, and stop pain points in productivity or engagement before they can become big problems.
5 HR KPIs Worth Tracking
There are a ton of potential metrics to follow. Don’t get bogged down in the numbers. Focus on evaluating what’s most necessary for your business and your specific role at your organization.
Need some guidance? Let’s check out a few HR KPI examples worth tracking.
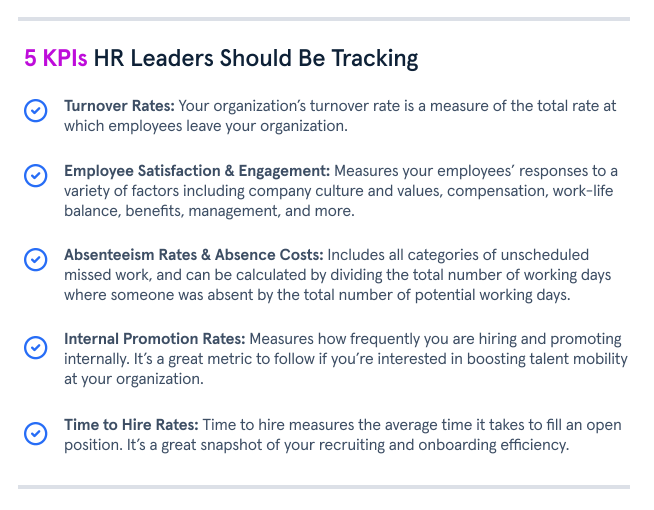
1. Turnover Rates
Your organization’s turnover rate is a measure of the total rate at which employees leave your organization. Tracking turnover is a natural choice for any people leader, and tracking this KPI in greater depth can give you excellent insight into why and when turnover happens. Here's how you can break this KPI down further:
Involuntary turnover, the number of employees terminated by the organization as a percent of the overall turnover rate.
Voluntary turnover, the number of employee-led resignations, presented as a percent of the overall turnover rate.
Unwanted turnover, which measures the percent of turnover where the employee lost was a top performer.
New hire failure rate, often called a 90-day quit rate, measures the number of employees who leave within a certain time frame after being hired – usually within 3 months or a year.
Analyzing these rates, identifying when they were highest and lowest, and what was happening at your organization at the time, can help you pinpoint the causes of turnover at your company. A high 90-day quit rate, for example, could mean there are issues with your recruiting or training processes.
2. Employee Satisfaction & Engagement
Employee satisfaction and engagement are multifaceted metrics, measured on your employees’ responses to a variety of factors including (but not limited to) company culture and values, compensation, work-life balance, management, and benefits. Satisfaction refers to an employee’s overall happiness in their role, while engagement is a measure of their dedication to and enthusiasm for their work.
Low satisfaction and engagement are major predictors of turnover, particularly among younger workers, while high ratings usually translate to increased productivity and retention, making these crucial HR KPIs to track. To accurately measure them, you’ll need to conduct regular, anonymous surveys to get employee feedback.
3. Absenteeism Rates & Absence Costs
Absenteeism includes all categories of unscheduled missed work, and can be calculated by dividing the total number of working days where someone was absent by the total number of potential working days. From there, calculate the average value of those missed hours to get the absence cost.
Like turnover rates, absenteeism rate KPIs may be more informative when broken down further. Track the specific reason for missed time, or scale your tracking up or down, from individuals to entire teams. Use these identifiers to refine your current attendance and absence policies, predict periods where absenteeism will be more likely, and potentially make changes to mitigate absences at your organization.
4. Internal Promotion Rates
This KPI measures how frequently you are hiring and promoting internally, and it’s a great metric to follow if you’re interested in boosting talent mobility at your organization. Like other HR KPIs, this can be broken down further to examine how inclusive your advancement strategies are – an important factor in improving diversity, creativity, and productivity.
Internal promotion rates can be calculated by dividing the number of internal promotions by the total number of promotions at your organization.
5. Time to Hire Rates
Time to hire measures the average time it takes to fill an open position. It’s a great snapshot of your recruiting and onboarding efficiency, and as you gain more data, you’ll be able to better predict how much time it will take to find a good fit for a specific role or skill set and potentially cut down on recruiting costs and time.
How to Effectively Put Those KPIs to Good Use
On its own, a KPI is just a number. There are a few extra steps you’ll need to take to ensure you’re getting the most out of your data…
Ensure the collection of KPIs you’re tracking are relevant to your organization, well-aligned with each other, and actionable – that is, categories that can be improved upon. Work with leaders and other departments to pinpoint what would be most useful to follow.
Load your numbers into a KPI dashboard, which presents your live data in easy-to-read charts and graphs. Your HRMS may come with KPI tracking software out-the-box. You can also build your own in Google Sheets, or purchase specialized software if your budget allows.
Be consistent about tracking, and ensure relevant people always have access to the data. If you’re having to enter data manually, make sure to schedule updates at regular intervals. A good KPI dashboard will give a real-time view of progress, leading to more agile decision-making.
Give your data time to grow, and load in historical data if you have it. A few weeks’ worth of numbers probably isn’t going to tell much of a story. The more data you have, the clearer your final picture will be.
Analyze that data! Raw numbers can give some insight, but comparing those numbers against each other, and against historical and industry data, can paint a detailed picture of performance at your organization. Some dedicated KPI software will generate analysis for you, often right there on your dash. If you aren’t using software like this, though, you may need to format your data into a KPI report, yourself.

